![]() Natural Capital
Natural Capital
Climate change is one of the most pertinent issues of our times. At HDFC Bank, we are continuously transforming our operations to achieve lowcarbon growth. We have set a target to achieve carbon neutrality for our Scope 1 and Scope 2 emissions by FY32 and are formalising a roadmap covering phased emission and energy reduction targets.
Governance
Our Board-governed environmental policy serves as a framework to understand and manage our environmental risks, impacts and opportunities. Our Board of Directors sets courses and evaluates our performance on social and environmental responsibility. We are continuously working to incorporate environmentally responsible practices in our own operations, through our vendors, as well as through responsible financing. No cases of noncompliance with environmental laws and regulations were identified during the year. We track our GHG emissions and transparently report our environmental performance annually.
Metrics and targets
We monitor KPIs for all major environmental indicators and initiatives covering energy, GHG emissions, water and waste for all our operations and aim to minimise the environmental impact thereof. We report on climate-related disclosures through the Carbon Disclosure Project and our TCFD disclosures, which are included in this report. Towards this end, the Bank is formalising a roadmap to guide its journey towards carbon neutrality. The roadmap consists of phased emission and energy reduction targets. More details on this can be found in subsequent chapters.
#Base year for targets for energy and emissions: FY22.
*‘Carbon Neutral’ targets include the use of offsets and reflect neutrality over projected emissions in the corresponding year. **Including both demand & supply measures
Our Scope 1 emissions includes emissions from fuel consumption in own vehicles and DG sets. Scope 2 emissions include emissions due to purchased electricity. Energy consumption as discussed in this report includes energy consumed by the Bank within its operations – including electricity, and fuel consumed in DG sets at locations where it has operational control as well as its co-located data centres and company vehicles. All targets are based on accelerated emission reduction scenario used in our integrated carbon neutrality roadmap.
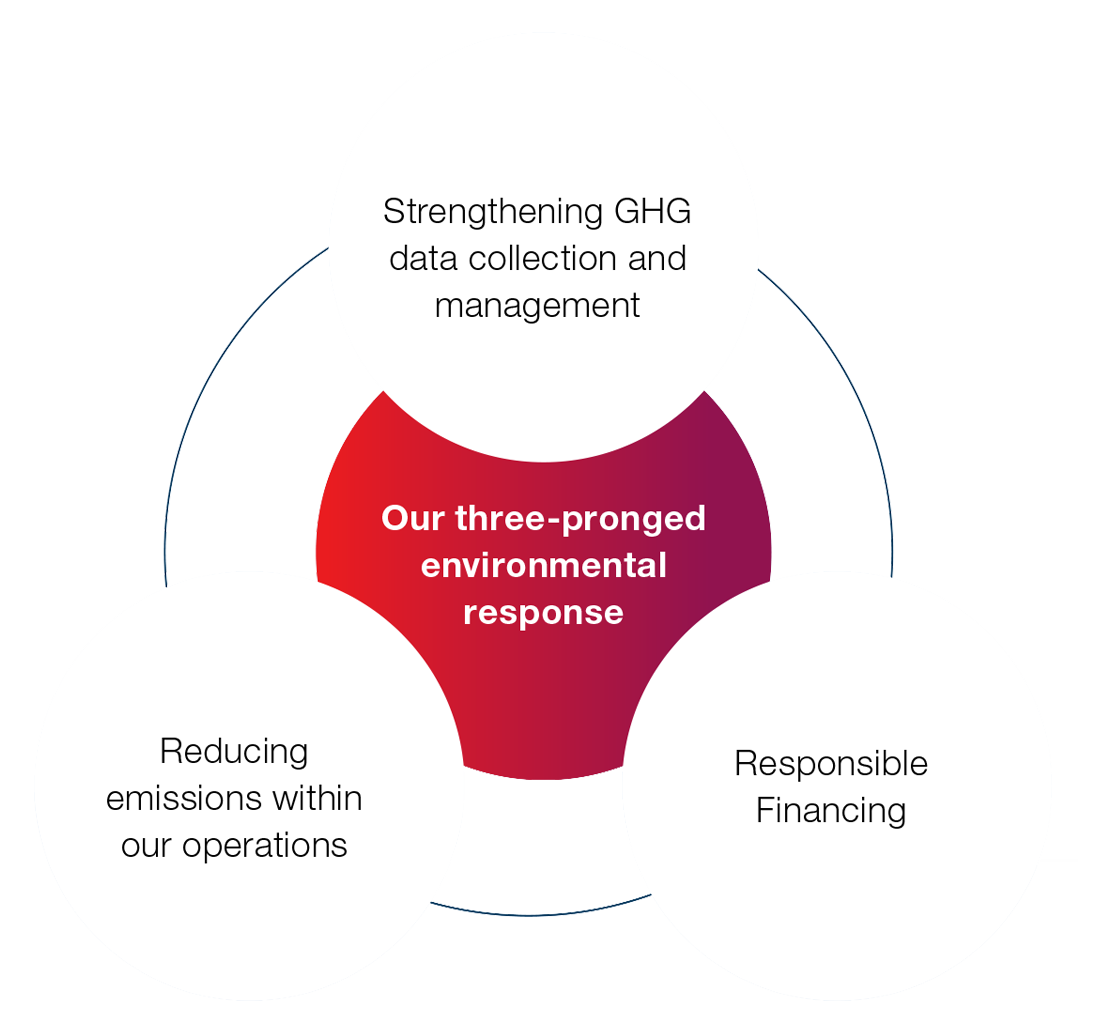
Initiatives to reduce environmental footprint
We are working to align our business operations with socially and environmentally responsible practices.
We are incorporating both technological as well as process solutions in our day to day operations in
order to add value to the quality of environment.
 Digital Banking Initiatives
Saved about 2.1 Million square feet of paper through our ‘green event’ initiative
Implementation of digital banking initiatives like Phone banking, Mobile banking, Net Banking, ATM banking, Mobile wallet
 Energy Reduction Initiatives
Committed to have only LED lights in all our buildings
Installation of inverter ACs and use of LED lights
Several changes within our infrastructure assets have been incorporated to improve energy efficiency
IGBC certification of buildings and interiors of branches
Our Bangalore data centre “NetMagic DC38” is certified green data centre under the IGBC
Implemented energy management system (EnMs) across 600 branches. EnMs to be scaled to 1,500 additional branches
 GHG Sequestration
Transparent disclosures of GHG emissions (third-party assured)
17.69 Lakh+ trees planted so far
Target to plant 25 Lakh+ trees by FY25
 Renewable Energy Initiatives
Install solar panels in our upcoming office buildings wherever feasible
Use offsite renewable energy and green tariff from utility
GHG emissions and climate change
At HDFC Bank, we have put in place an integrated strategy for managing our scope 1 and scope 2 emissions (refer page 69 and 70). As we had surpassed our previously set targets, we have taken on new targets with FY22 as base year. Our emission sources included in our base year GHG inventory demonstrates an enhancement of our ambitions and transparency goals. Not only have we ensured the completeness of our Scope 2 emissions from already identified source categories, but also included our colocated data centres as a source category for our scope 2 emissions. Similarly, we have added a new source category for our Scope 3 emissions – emissions on account of electricity consumption at our other facilities.
Enhancements to our emissions boundary and scope
Enhancing the boundary of Scope 2 emissions
Co-located data centres included in the boundary for Scope 2 emissions
Ensuring completeness of Scope 2 emissions boundary
Captive and Offsite ATMs (previously excluded due to non-availability of monitored activity data) are now included on the basis of emission estimation methodologies
Realignment of Scope categories for diesel use emissions in gensets
Emissions on account of diesel consumption in diesel generator sets are now accounted for under Scope 1, instead of Scope 2
Enhancing the boundary of Scope 3 emissions
We are now including facilities other than those owned & operated by the Bank as a separate category in our scope 3 emissions
As a result of the enhanced boundary and scope, our total GHG emissions for FY22 increased 11% y-o-y by 36,100 tCO2e, of which 92% (33,136 tCO2e) is attributed to the addition of a new source category. Another 12,728 tCO2e was added to the inventory on account of electricity consumption from our co-located data centres.
Thus, overall, there is a net reduction in GHG emissions in FY22 considering only the sources that were included in FY21 reporting. As a result, the share of Scope 1 and Scope 3 in our total emissions profile increased to 6% and 12%, respectively. Scope 2 emissions maintained 82% share in our total emissions.
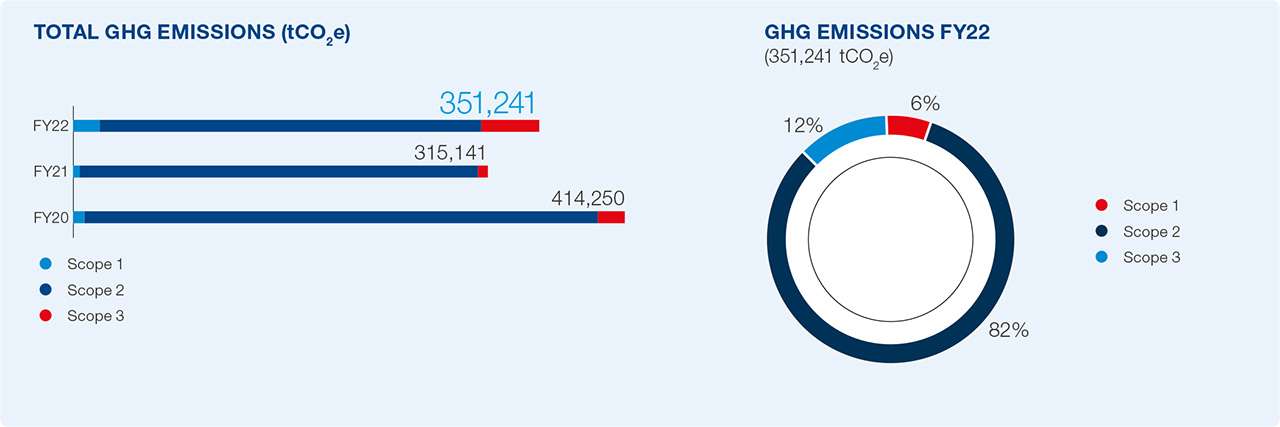
Our Scope 1 emission increased from 5,826 tCO2e in FY21 to 20,877 tCO2e in FY22, primarily on account of inclusion of emissions from diesel consumption in generators – which were previously included in Scope 2. This is because we have actual/ perceived control on the fuel consumed at a significant number of our branches and office locations. Fuel consumption in company-owned vehicles account for about 41% of our Scope 1 emissions while diesel consumption in diesel generators account for the remaining 59%.
Our Scope 2 emissions decreased by 12,474 tCO2e in FY22 over FY21, of this 9,570 tCO2e was on account of shifting emissions from diesel generators to Scope 1. Emissions on account of purchased electricity decreased by 2,904 tCO2e, despite the inclusion of our co-located data centres and an increase in the number of other locations in Scope 2 inventory.
We are committed to collaborating with our data centre service providers to reduce the GHG footprint of our owned and co-located data centres. Currently, data centres contribute 7% of our Scope 2 emissions. This year, we also enhanced our approach towards calculation of Scope 2 emissions. We have stepped up our efforts to collect actual electricity consumption data for estimating corresponding GHG emissions. In doing so, we are prioritising high-consumption locations. In FY22, we collected actual kWh data on electricity consumed from 46% of our locations – which collectively consumed about 50% of electrical energy.
For remaining locations, we track the cost of electricity consumed through our robust financial management system and use the same to derive estimates of electricity consumed using the most conservative tariff for commercial slabs at the state level. There are some of our smaller locations like ATMs for which we are in the process of establishing systems to collect activity data. For such locations, we are estimating electrical energy consumption based on a methodology that takes into account the climatic zone in which such locations are based, and energy consumption benchmarks derived from data on actual electrical energy consumption collected by us in similar locations. Although electrical energy consumption at such ATMs is only about 4% of our total electrical energy consumption, we are progressively enhancing our systems to capture actual activity data on electrical energy consumption for all locations.
In FY22, our Scope 3 emissions increased significantly over FY21, primarily on account of inclusion of emissions due to electricity consumption at other facilities. These emissions now account for 78% of our total Scope 3 emissions. The remaining 22% of our Scope 3 emissions are split between emissions due to hired cabs (13%), air and rail travel (2%), paper waste (7%), and e-waste (<1%).
SCOPE 1 EMISSIONS (tCO2e)

SCOPE 2 EMISSIONS (tCO2e)

ELECTRICITY EMISSIONS
(287,667 tCO2e)

We have expanded the reporting boundary for our Scope 2 emissions. This year onwards, we will be including emissions relating to use of purchased electricity at our co-located data centres in our Scope 2 emissions.
SCOPE 3 EMISSIONS (tCO2e)

SCOPE 3 EMISSIONS
(42,697 tCO2e)

| Emission Scope | Emission Source | Emissions (tCO2e) |
|---|---|---|
| Scope 1 | Company-owned Vehicles | 8,534 |
| Diesel consumption in DG sets | 12,343 | |
| Scope 2 | Purchased electricity | 287,667 |
| Scope 3 | Purchased electricity in other facilities | 33,136 |
| Cab Hire | 5,600 | |
| Air Travel | 950 | |
| Rail Travel | 2 | |
| Paper Waste | 3,006 | |
| E-waste | 4 |
Notes:
Scope 1 emissions includes CO2, N2O and CH4 emissions from the combustion of diesel purchased by the Bank for its various facilities, as well as combustion of various fossil fuels in Bank-owned vehicles. For the former, diesel purchase data is extracted from the Bank’s financial management system and the cost of diesel purchased is converted into liters of diesel using conservative estimates of diesel prices in various states. For the latter source, activity data in terms of quantity of fuel has been extracted from the financial management system. Emission factors and GWP from GHG Protocol’s Cross sector tool and IPCC’s AR5 respectively have been used.
Scope 2 emissions include GHG emissions from electricity consumed in the facilities that can be reasonably considered to be under the operational control of the Bank, as well as its co-located data centres. A hierarchical approach has been followed for estimation of emissions from this category (i.e. (i) monitored data on electrical energy consumption, (ii) estimates of electricity consumed based on procurement costs and state-level tariff; and (iii) estimated electricity consumption based on climatic-zone specific, internally derived electricity consumption benchmarks; in that order). In all cases, Grid emission factor from version 17 of the CEA’s (Central Electrical Authority) CO2 database has been used.
Scope 3 emission estimation: Emission on account of purchased electricity at our other locations have been estimated using the same approach as in Scope 2 but includes other facilities not included in Scope 2 emissions. Emissions from hired cabs have been estimated based on expense report for hired cabs from the Bank’s financial management system – which has been used to derive the distance travelled. Average of emission factor for various categories of cars from the India GHG programme has been used. For domestic air and rail travel, information on trip characteristics has been extracted from the Bank’s financial management system, and the distance travelled is derived from publicly available sources. The emissions have been calculated in accordance with the India GHG programme. For international travel through air, the source of data remains the same, but emission factors for different class of travel and haul categories have been derived from the GHG protocol.
Emissions from paper and e-waste have been estimated based on emission factors provided by the latest version of the USEPA’s WARM tool on the extracted data for paper used and e-waste disposed.
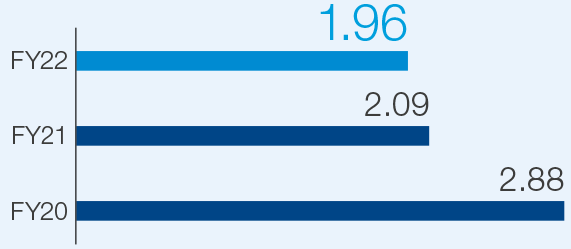
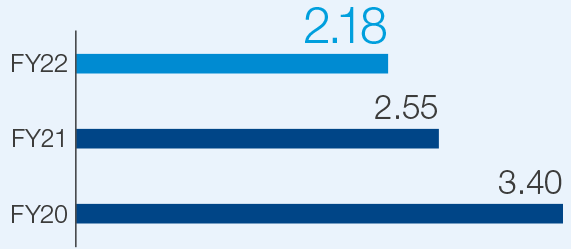
We have been monitoring our energy performance by benchmarking it against the Bank’s income and full-time employees (FTEs). During FY22, our Scope 1+2 GHG emissions intensity decreased by 14% and 6% y-o-y for per FTE and per Crore income, respectively.
Key measures to reduce GHG emissions across our value chain
Reducing paper waste emissions:
Our digital strategy forms the backbone of our paper waste reduction initiatives. Our digital products and services, along with automation of several internal as well as customer-linked processes and channels, have enabled us to reduce paper waste generation. The ‘Green Event Guidelines’ rolled out by our retail marketing team has helped save about 2.14 Million square feet of paper during the reporting year. We have also shifted to electronic payments for our electricity bill payments – which helps avoid paper use for issuing about 50,000 Demand Drafts annually. Where paper use is unavoidable, we are switching to recycled paper. As a result, associated emissions increased by less than 2% y-o-y in FY22, despite an 18.3% increase in our customer base.
Tree plantation: We are also implementing an ambitious tree plantation programme, under which we have planted over 17 Lakh trees so far. This programme has not only positively impacted our GHG emissions, but has also helped enhance our social capital and relationship capital.
Energy efficiency and energy management
over 80% of our GHG emissions are attributed to energy consumption in the form of electricity and diesel consumption in DG sets. We are aggressively working to reduce our energy consumption across operations to complement our initiatives to decarbonise. This is being achieved by reducing energy consumption across our operations by regulating existing equipment, installing energy-efficient ones, and implementing automated energy management solutions, among others. Our energy management and energy efficiency strategy includes various initiatives.
Energy efficient space cooling measures: We have installed 55 Air Handling Units (AHUs) at our Kanjurmarg location and we are planning to replace all blowers to EC Fan by FY23, indicating potential savings of 25-40%. Thus far, we have converted one AHU as a trial and saved around 4,082 kWh of electrical energy while avoiding 4 MT of carbon emissions. We are installing inverter ACs in our locations that has helped us save 5 Million+ kWh of electricity during FY22. Additionally, we have also saved 54,450 kWh of electricity during the year, through installation of VRF HVAC Unit at our back offices. We use digital systems and data analytics to understand the energy consumption pattern, in addition to ensuring that the branches are maintained at optimal temperatures, improving the power factor and automating major energy consuming assets.
Efficient data centres: Our Bangalore data centre, ‘Netmagic-DC3B’ is a certified green data centre under the IGBC Green Data Center Rating System. We have implemented several other energy-saving measures including upgradation to efficient cooling units, cold-aisle containment, replacement of old storages and servers and with new generation hardware, and implementation of Smart iPDUs. Additionally, we have switched to R-407c refrigerant for INROW cooling, deployed new fire suppression system with NOVEC 1230 gas, and replaced UPS batteries with Li-ion batteries.
GHG EMISSIONS INTENSITY
Scope 1 + Scope 2 (tCO2e / ` Cr income)
GHG EMISSIONS INTENSITY
Scope 1 + Scope 2 (tCO2e / FTE)
Our digitised processes and products have helped customers reduce their frequency of visits to the Bank’s branches, ATMs, and Offices - thereby reducing associated emissions.
tCO2e/ per year
CO2 SEQUESTRATION POTENTIAL CREATED THROUGH PLANTATION ACTIVITIEStCO2e/ per year
REDUCTION IN SCOPE 1+2 EMISSIONS PER CR INCOME IN FY22tCO2e/ per year
REDUCTION IN SCOPE 1+2 EMISSIONS PER FTE IN FY22FOR OUR DATA CENTRE IN BANGALORE

Building management and Green Buildings: We have incorporated several changes within our infrastructure to improve energy efficiency through auto controls and environment-friendly equipment. We have installed centrally controlled energy management system in 600 branches across India till date. This system allows us to control consumption patterns, resulting in a minimum of 10% saving on power consumption. In FY22 alone, we saved ~48.81 Lakh units. Based on encouraging results from this project, we plan to expand the initiative to an additional 1,500 branches across the country.
We have LEED Gold certified offices in Mumbai and Bhubaneswar. In addition, new buildings in Mohali, Kolkata Palava and Mumbai (Maharashtra) premises are being constructed to meet IGBC Gold certification standards. Similarly, our Wanowrie back-office has been designed as per IGBC Green standards; we have received IGBC Gold rating for it. All new interior work carried out during and after FY22 are being designed as per IGBC Green standards. So far, interior work at 378 branches is being carried out as per IGBC Green standards and one branch in Maharashtra has received Gold rating.
Besides, we are leveraging technology and innovation as facilitators in our journey towards low-carbon growth. We have implemented elevator and equipment scheduling to reduce our energy consumption. We have also installed occupancy sensors, capacitor banks as well as Building Management Systems at several of our operating locations. The energy management modules with auto controls deployed across select branches have resulted in significant energy savings.
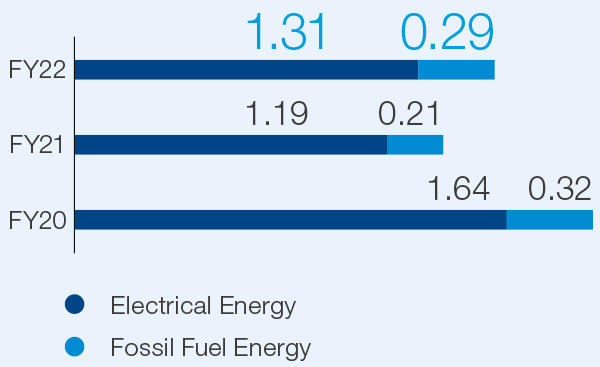
TOTAL ENERGY CONSUMED
(Million GJ)
TOTAL ENERGY CONSUMED
(GJ/employee)

TOTAL ENERGY CONSUMED
(GJ/ ` Cr income)

Million kWh
ENERGY SAVED DURING FY22 ONACCOUNT OF EnMS IMPLEMENTATION
| Energy Consumption | GJ |
|---|---|
| Diesel: DG Set | 165,586 |
| Diesel: Company Cars | 38,599 |
| Petrol: Company Cars | 81,417 |
| CNG: Company Cars | 9 |
| Grid Electricity | 1,310,888 |
Renewable energy
With the goal of gradually decarbonising our energy consumption, we are steadily increasing the share of renewable energy in our overall power consumption. We have installed rooftop solar plants at our offices in Jaipur, Pune, Noida, Bhubaneswar, Chandigarh, Mumbai and Mohali.
In Maharashra, we are gradually shifting our branches to run on green power procured through DISCOMs at a premium. So far, 14 of our branches are operating on green power, resulting in annual avoidance of ~905 MT carbon emissions on 1,028 MWh of procurement per annum.
Managing waste
We are working progressively towards sustainable management of waste generated from our operations. We deal with three types of non-hazardous waste – e-waste, dry waste (paper waste) and wet waste (cafeteria, sewage), of which e-waste is disposed through authorised recyclers. A total of 212 tonnes of e-waste was generated in FY22, because of asset refresh, damaged and non-functional assets. For paper waste and wet waste, we are developing a management plan in consultation with our partners. We have already initiated pilots at select locations and intend to scale it up over the next few years. We continue to work towards establishing and implementing systems and procedures for tracking wet and dry waste from our operations.
We are also aggressively working towards minimising the use of plastic bottles. Single use plastic bottles have already been phased out from all our hub offices pan-India, and we have replaced multiple use plastic water bottles with glass jars across all meeting and video conferencing rooms. Hazardous waste within our scope, arising from diesel/fuel oil used in generator sets, is negligible.

Responsible financing
ESG and climate change are becoming increasingly important from the perspective of borrower credit evaluation, as well as regulators and other stakeholders. We are following a two-pronged approach to address ESG and climate change risks in our lending portfolio. On one hand, we seek to ensure adoption of and adherence to complete ESG and Climate Change assessment across multiple business divisions when issuing credit facilities, based on interactions with stakeholders, external agencies and relevant literature. On the other hand, we are engaging with some of our largest corporate borrowers to better understand their ESG strategies and transition plans for managing climate risks.
Our credit policy requires that no funding be provided for establishing new manufacturing units that produce or consume ozone-depleting substances, and that no financing be provided to small- and mediumsized businesses that manufacture aerosols containing CFCs. Besides, as a standard practice, we require all loans, including project loans, to be approved by a Credit Approver/Senior Credit Approver with the necessary approval authority. Due to the elevated risk involved with large project loans, the extension of financing for such projects require additional approvals from senior management/the Board to ensure adequate scrutiny of the proposals.
Evaluation of environmental and social risk is an integral part of our overall credit appraisal and approval process.
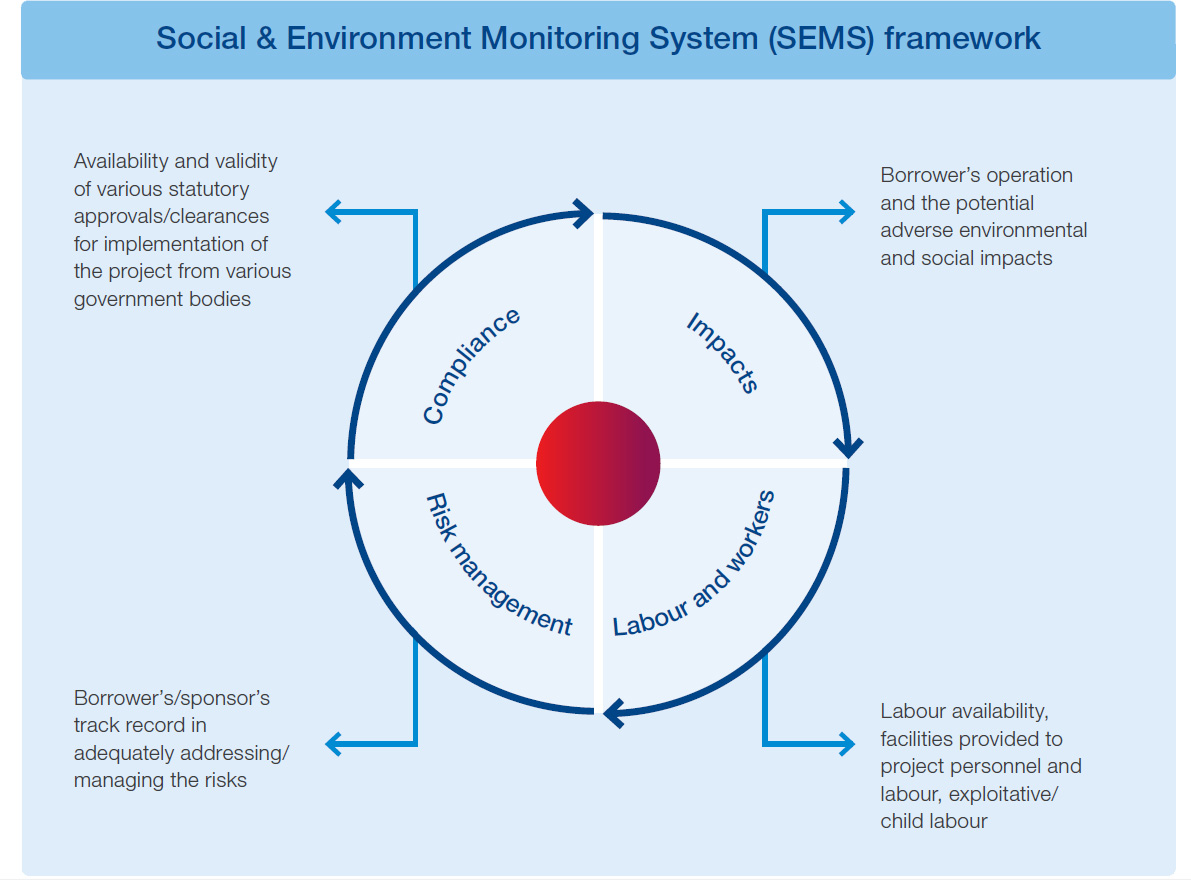
Long-term financing proposals for large industrial/infrastructure projects (greater than `100 Million and tenor above 5 years) are evaluated through the SEMS framework, which requires an assessment of Environmental, Health, Social, and Safety risks in addition to other risks as part of the overall credit appraisal process. This comprehensive assessment involves evaluating the borrower's operations, as well as any potential negative environmental and social consequences. We have already mapped potential impact categories for risk evaluation of specific, capitalintensive industries such as roads and highways, thermal power, power transmission, cement, hydroelectric power, and manufacturing, among others, to guide the assessment process. In addition, the SEMS framework includes assessment of aspects related to labour availability and worker welfare, risk assessments, and compliances and approvals. In FY22, 861 loan proposals were screened through the SEMS framework.
For select large project finance transactions, we appoint a Lenders' Independent Engineer (LIE) for conducting an environmental and techno-commercial evaluation of the project prior to loan disbursement. Any loan disbursement is subject to the correction of deficiencies related to environmental and social risks identified by LIE. During the construction stage as well, the LIE continues to monitor the project and flags any risks associated with environmental/social issues in the project to the Bank and borrower for necessary corrective action.
Where required, we place predisbursement stipulations/terms of sanction to mitigate adverse environmental and social impacts, collect undertaking of compliance with applicable regulations and criteria, and monitor ongoing compliance on an annual basis.
Our lending procedures are guided by borrower and market demand, but our credit exposure is well-diversified, with no single industry having a high concentration. As a result, our credit exposure to ecologically/ socially sensitive industry sectors has minimal negative consequences. We also finance entities that deals with environmental and social issues.

Less than 1% of the total exposure comes from fossil fuels (coal and lignite) and their extraction/mining

No exposure of chemical or biological weapons manufacturing enterprises; the Bank provides a substantial amount of funding to the healthcare industry to meet the funding requirements of hospitals, diagnostic labs, and clinics
Solar and wind power, hydroelectricity, natural gas (extraction and distribution), and biogas-based energy generation are a mong the Bank’s environment-friendly industry sectors for lending

Financing to regional rural banks, NBFC and microfinance that are key financial intermediaries to agriculture workers, self-help groups, MSMEs, etc. through direct lending (term loans, working capital loans, etc.) and/or through purchase of receivables through the securitisation/direct assignment/IBPC route
Upgrading to a new ‘ESG & Climate Change Assessment’ framework
We have identified upgradation of the SEMS framework as a priority activity and have been working on revising the SEMS framework with a ‘ESG & Climate Change Assessment’ framework to enable a more comprehensive assessment of ESG and Climate Change issues. We have also been working on expanding the coverage of the assessment framework. Our newly formulated and exhaustive ‘ESG & Climate Change Template’ shall be applicable to all Credit Assessment Memoranda (CAMs) where the aggregate CAM appetite crosses a certain threshold, rather than at a transactional level, as is the current practice. This template shall be included in all CAMs where direct customer exposure is above a certain threshold.
ESG and climate change template – key highlights
The impact of specific environmental risks – emissions, radiation hazards, biomedical/ industrial waste, deforestation, etc. as well as mitigating factors in terms of systems and processes to cope with negative impacts

Impact of social issues – land acquisition, resettlement and rehabilitation, labour safety, etc.

Qualitative assessment of the physical and transition risk of climate change on the borrower’s activities

Evaluation of the availability and sufficiency of legislative clearances/ compliances in the areas of pollution control and effluent treatment

Positive aspects of the Company’s environment impact, such as biodiversity conservation and community engagement
To complement our ESG and Climate Change risk assessment framework, we are tailoring our own corporate loan portfolio towards climatesensitive financing and to companies with robust systems and processes. For this purpose, we have begun engaging with select customers to understand their current ESG strategy, compliance, reporting frameworks and ESG ratings; their operations, and long-term climate transition plans for carbon footprint reduction through process improvements in existing operations, business transitions, such as de-commissioning of certain lines of business and investment in 'clean' technologies; and targets for water consumption reduction, emission reduction, etc.
The Product Responsibility subcommittee of our ESG action committee focuses on identifying new opportunities in the Environmental and Social space, such as Green Bonds. We aim to provide access to capital for environmentally sustainable projects that contribute to climate change mitigation.
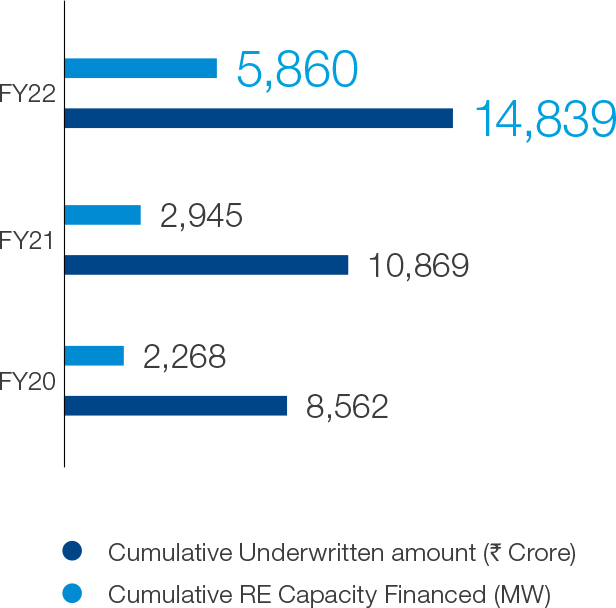
We also finance renewable energy projects. So far, we have underwritten loans of `14,839 Crore for a cumulative capacity of 5,860 MW (solar capacity of 3,386 MW and wind of 584 MW).
We have also financed city-gas distribution networks under Minimum Work Program with a total underwritten amount of `2,393 Crore for 794 CNG stations and over 4.6 Million domestic connections. In FY22, we also partnered with Indore Clean Energy Private Limited for financing Asia’s largest waste to energy plant at Indore, Madhya Pradesh. This plant aims to treat 50% of municipal waste generated in the city and convert it to 100% biogas and manure.
RENEWABLE ENERGY FINANCING
Achieve carbon neutrality by 2032
In June 2021, the Bank pledged to become carbon neutral by FY32. We are in the process of rolling out an integrated actionable strategy roadmap comprising three mitigation pillars and three management pillars. The next decade will be a ‘Decade of Action’ for the Bank, as we will build on each of these pillars to make meaningful and systemdriven changes within the organisation to achieve our carbon neutrality goal.
Our target includes GHG emissions generated by our operations arising from the combustion of fossil fuels (Scope 1 emissions) as well as emissions from the generation of purchased electricity consumed by the Bank (Scope 2 emissions) at its operating locations and its owned and co-located data centres. The target covers carbon dioxide (CO2), nitrous oxide (N2O), and methane (CH4) emissions.
Our integrated strategy for achieving carbon neutrality is based on a detailed assessment of our key operational parameters. The baseline emissions were established based on the latest dataset available, which fed into an integrated tool for forecasting emissions. The projected emissions based on a likely business growth scenario were laid over with multiple scenarios of emission reduction pathways to understand cost and potential reductions under each scenario. Based on an engaging and deeply consultative process with our departmental teams and ESG action committees, we have set our eyes to achieve carbon neutrality based on the following interventions:

Demand-side energy management
We are in the process of adopting a broad range of technological solutions and operational measures to reduce energy consumption at our operating locations. We have mapped Energy Performance Indicator (EPI) for all our locations and are using it as an internal benchmark for the energy performance of all types of facilities. We have shortlisted various demand-side interventions for phase-wise implementation across locations based on an assessment of feasibility and RoI. These measures include smart IoT-based building management systems, modular UPS systems, air-conditioners with high ISEER rating using Brushless DC Motors (BLDC) technology, etc.
Supply-side energy interventions
We seek to progressively decarbonise our energy consumption and are increasingly adopting lowcarbon energy sources to support our operations. Our supply-side strategy focuses on gradual shifting to green tariffs offered by utilities wherever available and procurement of renewable energy from offsite power plants and exchanges. The green tariff option, which is currently available only in a few states (Maharashtra, Karnataka, Andhra Pradesh) is expected to be made available and affordable in more states, and therefore in the interest of sustainability, we plan to make use of the offering on a gradual basis, despite a premium over the existing electricity rates. In large locations where regulatory requirements for open access and wheeling are met, renewable energy will be procured from offsite power plants, either directly or through power exchanges. The initial list of locations where renewable energy procurement is planned to be taken up is already identified. A firm-level policy guideline on making maximum use of green energy supply interventions in existing and new locations is also being finalised. If and when required, we may also utilise green certificates for carbon neutrality compliance.
Carbon Credits and Offsets
Carbon offsets will continue to play a role in addressing the balance of our residual emissions. We will evaluate and leverage carbon offsets and assess opportunities to develop mitigation and abatement projects through technological and nature-based solutions. We intend to engage in voluntary markets, and in compliance markets when the latter is applicable to our business operations. When participating in voluntary carbon markets, we will carry out due diligence to ensure that we retire the highest quality offsets, which are verified by internationally recognised standards such as Verra, Gold Standard, etc., to balance our residual emissions. We will adopt a two-pronged approach to secure the availability of offsets for retirement. While we may make direct investments in carbon offset generating projects in collaboration with our partners, we may also need to purchase carbon credits from various market options on a need basis for retirement against our residual emissions. While investing in carbon offset generating projects, we will prioritise projects that add socioeconomic- ecological value to the communities in which we operate, and those projects which are in proximity to our operations in India.
The ‘management’ related pillars of our carbon neutrality strategy pertain to developing firm-level guidelines for operations and procurement for supply-side and demand-side interventions, establishing a framework for coordinated action between key teams for implementation and continuously enhancing the GHG data collection processes to improve the quality of the inventory. We will also monitor the implementation of interventions and progress towards our emission reduction targets every two years and realign our integrated strategy incorporating the best available technologies and measures.
Our roadmap to 2032
We have identified six strategic pillars to ensure that our journey to carbon neutrality is meaningful and brings about a systems change within the organisation
Demand-side measures
Adopting a broad range of technological solutions and O&M measures to reduce energy consumption at our operating locations
- Installation of Modular UPS System
- IoT-based building management systems
Supply-side measures
Supporting our operational locations with energy supplied from low-carbon sources
- Green tariff from utility
- Offsite RE procurement
- Green certificates
Carbon credits and offsets
Neutralise our residual Scope 1 and Scope 2 emissions by investing in carbon offset projects or purchasing carbon credits
- Co-investing in offset projects
- Forward ERPA
- Retail purchase
Guidelines for HDFC Bank’s operations
Firm-level guidelines for operations and procurement for supply-side and demand-side intervention
Steering mechanism
Framework for coordinated action between key corporate level and facilities level teams for implementation
Continual improvement
Continuously enhancing our data collection processes to iteratively improve the quality of the inventory and guide progressive inventory improvement
Carbon neutral
by FY32
FOR SCOPE 1 AND 2 EMISSIONS
Our Carbon Neutrality strategy formulation is based on a detailed review of operational parameters informed by the most recent dataset available. We have established our baseline emissions data and projected emission for a likely scenario business growth, superimposed with future abatement.
TCFD disclosures
HDFC Bank recognises the growing concerns of regulators, investors and clients about climate risks that businesses, particularly banks and financial institutions, face. This is our second year of working on the recommendations of the Task Force on Climate-related Financial Disclosures (TCFD) – which provides a useful framework for identifying climate-related risks and opportunities, evaluating effective responses and communicating crucial information to stakeholders.
Governance
We have a strong Risk Management Group (RMG) at the Bank that oversees putting the Board's risk strategy into action, as well as designing procedures and systems for detecting, measuring, monitoring, assessing and managing risks. The RMG is led by the Chief Risk Officer (CRO), who is responsible for risk management and the entire risk architecture and framework of the Bank including stress testing. The Chief Information Security Officer reports on the Bank's cyber-security concerns as well as updates from Business Impact Analysis and Disaster Response.
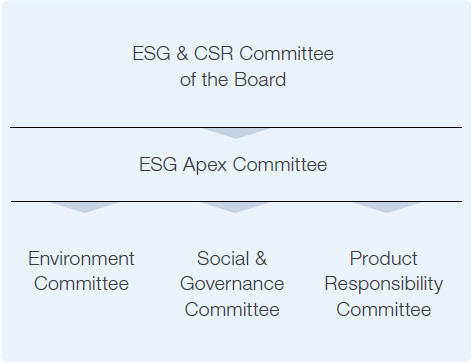
The Group Head for Corporate Social Responsibility (CSR) & ESG updates the CSR & ESG committee of the Board, every quarter on the Bank's sustainability (ESG) initiatives and progress on ESG actionables and chairs the ESG apex committee. The ESG apex committee governs and reviews the progress of the three action committees that drive the ESG agenda (including climate change) at the Bank.
The Product Responsibility sub-committee, examines Environmental & Social (E&S) risks in our operations, including climate risks, while finding new business opportunities in the E&S arena. The Environment subcommittee comprises of representatives from the Administration, Infrastructure and IT teams at the Bank, sets targets and identifies opportunities for improvement in areas of emissions, energy, water, and waste. This committee will continue to drive the Bank’s path towards achieving carbon neutrality. The Bank has a dedicated ESG vertical that works in conjunction with several internal and external stakeholders, to drive the ESG agenda.
Credit managers assess environmental risks arising from large loans through the SEMS framework.
Strategy
The Bank has been reporting to the Carbon Disclosure Project (CDP) on its climate change strategy, risks, opportunities, and emissions. From the perspective of climate risk assessment, we will assess the priority of physical and transition risks in the near to medium term. Some of the critical parameters to consider would be GHG emissions, air pollutants and climate transition risk pathways both at the sector and borrower level
There are two main types of climate-related risks:
- Physical risks (both acute and chronic): Economic losses (physical damage to property and assets) from extreme weather events (flood, cyclone, etc) attributed to climate change; and
- Transition risks: Possible process of adjustment to a low-carbon economy and its effects on the value of financial assets and liabilities
We are exploring frameworks to model and assess climate risks. We also continue to acquire granular data further corroborated by BRSR data (FY23 onwards) and test tools for climate risk assessment and conduct scenario analysis through suitable partnerships – including exploring options to tie-up with data providers. Given that climate risk is an emerging and long-term risk for the Bank, we will consider adopting a suitable methodology/pathway to analyse the Bank's exposures under different climate scenarios.
Risk Management

Current regulation
Banks are highly regulated in the country and mandates as part of current regulations are always integrated into the overall risk planning and assessment process. Current regulations are also factored in the credit assessment process, especially through the SEMS framework which is used to screen large loans for environmental and social risks.

Emerging regulation
Transition risk can impact the Bank's credit portfolio resulting from changes in the climate policy, technology, consumer, and market sentiment during the transition to a low-carbon economy. This is particularly relevant for policy changes that can result in loan defaults from certain sectors like coal, thermal and infrastructure. We are exploring techniques for developing climate risk assessment and scenario analysis to analyse our portfolio at risk due to the transition risk of climate change.

Technology
While our digital environment and information security standards are the foundation of our business today, as financial services professionals, we do not anticipate technology to have a significant impact on climate risk. Our low-carbon digital banking products use technology to enable business.

Legal
For large loans, we verify whether the project complies with all applicable environmental rules, failing to do so could result in the loan becoming a non-performing asset if the project goes into litigation. This, however, is not a claim against the Bank. There are no other circumstances in which the Bank can be held liable for a climate-related lawsuit.

Market
In the context of climate change, markets could play a key role in shifting the demand and supply for certain products like green loans or bonds, or in low-carbon digital products. However, we do recognise the relevance of change in consumer preferences, and hence, the need to evaluate this risk, but do not have the tools at present to quantify/include this as part of our risk assessment process.

Reputation
Reputation risk from community/customer perception is a primary risk to our business. We thus invest in community and customer involvement through surveys to educate and enlighten them on our environmental sustainability programmes. Further, ESG performance measures are increasingly being used by the global investor community, especially sovereign wealth funds and pension funds, to assess long-term profitable growth. We strive to implement environment-friendly measures throughout our operations. We further show our commitment to ESG, particularly climate change, by including ESG elements in regulatory reporting such as the annual report. In addition, in our annual integrated report, we publish details on our carbon emissions and footprint (third-party assured).

Acute physical
Acute physical hazards can have a negative influence on our credit portfolio by causing bad debts due to damage to property, infrastructure, and land. This is also relevant for climate disasters destroying assets (that serve as collaterals). We continue to measure physical risks from a climate risk assessment perspective and will assess the priority of these risks in the near-to-medium term. In addition, our Disaster Response and Business Continuity teams conduct business impact analyses and have rapid response procedures in place in the event of natural disasters such as floods.

Chronic physical
Chronic physical risks are far into the future. Given that climate risk is an emerging and long-term risk us, we will consider adopting a suitable methodology/pathway to analyse our exposures under different climate scenarios.
Evaluation of environmental & social risk is an integral part of our overall credit appraisal and approval process. Large industrial / infrastructure projects where the extension of long-term financing (greater than `100 million and longer than 5 years) are covered under the Bank’s Social & Environment Monitoring System (SEMS) which necessitates an assessment of Environmental, Health, Social, and Safety risks in addition to other risks as part of the overall credit appraisal process. This comprehensive assessment involves evaluation of various environmental and social aspects of the project and operations of the borrowing entity - such as the nature of the borrower's operations, as well as any potential negative environmental and social consequences. We have already mapped potential impact categories for risk evaluation of specific, capitalintensive industries such as Roads and Highways, Thermal Power, Power Transmission, Cement, Hydroelectric Power, and Manufacturing amongst others to guide the assessment process. While the bank's lending procedures are guided by borrower and market demands, the bank's credit exposure is well diversified across numerous industries, with no single industry having a high concentration. As a result, the Bank's credit exposure to ecologically / socially sensitive industry sectors has minimal negative consequences. In addition, as part of our credit policy, we do not extend finance for setting up of new units for producing/consuming ozone-depleting substances (CFC -11, CFC – 12, CFC – 113, Carbon Tetrachloride, Methyl Chloroform, Halons – 1211, 1301, 2402) and for small & medium scale units engaged in the manufacture of aerosol units using CFC.
We recognise the importance of water availability affecting our portfolio, especially in certain sectors like agriculture. As part of our credit due diligence, we evaluate loan proposals against water availability with an assured irrigation facility. In case of climate-linked events like droughts, we extend crop insurance facility to borrowers (who harvest at least two cropping cycles).

Metrics and Targets
We are firming up an integrated strategy to achieve carbon neutrality by 2032, which will set internal benchmarks for energy performance and targets for phased renewable energy integration. We will monitor the implementation of interventions and emission reduction achievements every two years and realign our integrated strategy incorporating the best available technologies and practices.
We plan to enhance our commitment to financing climate change solutions such as energy transition, renewables, energy efficiency, sustainable transportation, green buildings, climate smart agriculture, among others, besides monitoring the implications of our own operations. We are working on developing KPIs and setting goals to monitor, manage, and track the progress. This involves a thorough examination of our Scope 3 emissions and our carbon-related asset exposure. Please refer to the Environment section of this Report for details on our performance on emissions and energy-related KPIs.