|
|
|
|
| Equity Oriented Funds |
|
|
|
|
|
|
|
|
|
As on 27 November, 2020 |
| Funds Recommended based on Long Term Trends |
|
|
|
|
|
|
|
|
|
|
|
|
| Large Cap Funds |
|
|
|
Suitable for |
|
|
|
|
|
|
| Name of |
Inception |
SEBI Categorisation |
Riskometer** |
Aggressive |
Moderate |
Conservative |
NAV |
Returns for |
| Scheme |
Date |
|
|
|
|
|
Rs |
6 m |
1 yr |
3 Yrs |
5 Yrs |
Incep |
| S&P BSE Sensex Index |
|
|
|
|
|
|
|
39.69% |
7.61% |
9.39% |
11.05% |
-- |
| Nifty 50 Index |
|
|
|
|
|
|
|
39.23% |
7.15% |
7.63% |
10.29% |
-- |
|
| Nifty 50 TRI Index |
|
|
|
|
|
|
|
40.21% |
8.29% |
8.99% |
11.70% |
-- |
| S&P BSE 100 TRI Index |
|
|
|
|
|
|
|
39.90% |
8.57% |
7.70% |
11.53% |
-- |
| Nifty 100 TRI Index |
|
|
|
|
|
|
|
39.04% |
8.16% |
7.86% |
11.56% |
-- |
|
| Axis Bluechip Fund |
5-Jan-10 |
Large Cap Fund |
Moderately High |
Yes |
Yes |
Yes |
35.43 |
33.25% |
11.63% |
12.80% |
13.29% |
12.30% |
| Canara Robeco Bluechip Equity Fund |
20-Aug-10 |
Large Cap Fund |
Moderately High |
Yes |
Yes |
Yes |
31.01 |
34.59% |
15.28% |
11.57% |
12.81% |
11.64% |
| ICICI Prudential Bluechip Fund |
23-May-08 |
Large Cap Fund |
Moderately High |
Yes |
Yes |
Yes |
46.65 |
33.82% |
5.89% |
5.06% |
10.15% |
13.09% |
|
| Multi Cap / Dividend Yield Funds |
|
|
|
|
|
|
|
|
|
|
|
|
| Nifty 500 Index |
|
|
|
|
|
|
|
41.12% |
9.17% |
4.97% |
9.89% |
-- |
| S&P BSE 500 TRI Index |
|
|
|
|
|
|
|
42.13% |
10.57% |
6.37% |
11.34% |
-- |
| Nifty 200 TRI Index |
|
|
|
|
|
|
|
40.55% |
9.09% |
6.95% |
11.33% |
-- |
|
| UTI Equity Fund |
20-Apr-92 |
Multi Cap Fund |
Moderately High |
Yes |
Yes |
Yes |
183.74 |
48.62% |
22.59% |
13.07% |
12.92% |
12.56% |
| Canara Robeco Equity Diversified Fund |
16-Sep-03 |
Multi Cap Fund |
Moderately High |
Yes |
Yes |
Yes |
162.88 |
35.45% |
16.09% |
10.08% |
11.81% |
17.60% |
| Kotak Standard Multicap Fund |
11-Sep-09 |
Multi Cap Fund |
Moderately High |
Yes |
Yes |
Yes |
39.52 |
35.32% |
6.12% |
6.11% |
11.49% |
13.03% |
|
| Large & Mid Cap Funds |
|
|
|
|
|
|
|
|
|
|
|
|
| NIFTY Large Midcap 250 TRI Index |
|
|
|
|
|
|
|
45.55% |
14.19% |
5.68% |
11.88% |
-- |
| Nifty 200 TRI Index |
|
|
|
|
|
|
|
40.55% |
9.09% |
6.95% |
11.33% |
-- |
|
| Canara Robeco Emerging Equities Fund |
11-Mar-05 |
Large & Mid Cap Fund |
Moderately High |
Yes |
Yes |
Yes |
113.96 |
42.11% |
19.25% |
6.60% |
12.74% |
16.73% |
| Tata Large & Mid Cap Fund |
25-Feb-93 |
Large & Mid Cap Fund |
Moderately High |
Yes |
Yes |
Yes |
240.60 |
38.89% |
10.61% |
6.72% |
9.84% |
12.13% |
| Kotak Equity Opportunities Fund |
9-Sep-04 |
Large & Mid Cap Fund |
Moderately High |
Yes |
Yes |
Yes |
142.15 |
37.11% |
12.95% |
6.63% |
11.89% |
17.77% |
|
| Mid Cap Funds |
|
|
|
|
|
|
|
|
|
|
|
|
| S&P BSE Mid Cap TRI Index |
|
|
|
|
|
|
|
48.41% |
14.72% |
0.85% |
10.23% |
-- |
| Nifty Midcap 100 TRI Index |
|
|
|
|
|
|
|
53.44% |
16.73% |
0.34% |
9.47% |
-- |
|
| Axis Midcap Fund |
18-Feb-11 |
Mid Cap Fund |
Moderately High |
Yes |
Yes |
No |
47.67 |
37.10% |
21.11% |
12.96% |
13.71% |
17.31% |
| DSP Midcap Fund |
14-Nov-06 |
Mid Cap Fund |
Moderately High |
Yes |
Yes |
No |
69.03 |
40.97% |
22.41% |
7.25% |
13.22% |
14.74% |
| Kotak Emerging Equity Fund |
30-Mar-07 |
Mid Cap Fund |
Moderately High |
Yes |
Yes |
No |
47.17 |
48.06% |
18.23% |
5.34% |
12.30% |
12.01% |
|
| Small Cap Funds |
|
|
|
|
|
|
|
|
|
|
|
|
| Nifty Smallcap 100 TRI Index |
|
|
|
|
|
|
|
69.15% |
16.04% |
-7.94% |
4.72% |
-- |
|
| Axis Small Cap Fund |
29-Nov-13 |
Small cap Fund |
Moderately High |
Yes |
Yes |
No |
37.34 |
46.72% |
19.62% |
10.01% |
13.47% |
20.71% |
| Kotak Small Cap Fund |
24-Feb-05 |
Small cap Fund |
Moderately High |
Yes |
Yes |
No |
92.37 |
66.66% |
28.61% |
5.03% |
11.64% |
15.14% |
|
| Value / Contra Funds |
|
|
|
|
|
|
|
|
|
|
|
|
| S&P BSE 500 TRI Index |
|
|
|
|
|
|
|
42.13% |
10.57% |
6.37% |
11.34% |
-- |
| Nifty 500 Index |
|
|
|
|
|
|
|
41.12% |
9.17% |
4.97% |
9.89% |
-- |
|
| Invesco India Contra Fund |
11-Apr-07 |
Contra Fund |
Moderately High |
Yes |
Yes |
Yes |
55.58 |
37.23% |
13.78% |
6.78% |
12.61% |
13.40% |
| UTI Value Opportunities Fund |
20-Jul-05 |
Value Fund |
Moderately High |
Yes |
Yes |
Yes |
71.76 |
38.72% |
12.81% |
7.29% |
9.46% |
13.68% |
|
| Funds Recommended based on Long Term Trends |
|
|
|
|
|
|
|
|
|
|
|
|
| Focused Funds |
|
|
|
|
|
|
|
|
|
|
|
|
| S&P BSE 500 TRI Index |
|
|
|
|
|
|
|
42.13% |
10.57% |
6.37% |
11.34% |
-- |
| Nifty 50 TRI Index |
|
|
|
|
|
|
|
40.21% |
8.29% |
8.99% |
11.70% |
-- |
|
| SBI Focused Equity Fund |
17-Sep-04 |
Focused Fund |
Moderately High |
Yes |
Yes |
Yes |
166.59 |
33.80% |
8.96% |
8.63% |
12.63% |
18.96% |
| Axis Focused 25 Fund |
29-Jun-12 |
Focused Fund |
Moderately High |
Yes |
Yes |
Yes |
34.49 |
41.88% |
12.75% |
10.67% |
14.78% |
15.84% |
|
| Arbitrage Funds |
|
|
|
|
|
|
|
|
|
|
|
|
| Nifty 50 Arbitrage Index |
|
|
|
|
|
|
|
0.48% |
2.35% |
4.59% |
4.87% |
-- |
|
| L&T Arbitrage Opportunities Fund |
30-Jun-14 |
Arbitrage Fund |
Moderately Low |
Yes |
Yes |
Yes |
14.79 |
1.55% |
4.72% |
5.65% |
5.84% |
6.29% |
| Kotak Equity Arbitrage Fund |
29-Sep-05 |
Arbitrage Fund |
Moderately Low |
Yes |
Yes |
Yes |
28.68 |
1.36% |
4.23% |
5.63% |
5.88% |
7.19% |
| Aditya Birla Sun Life Arbitrage Fund |
24-Jul-09 |
Arbitrage Fund |
Moderately Low |
Yes |
Yes |
Yes |
20.54 |
1.16% |
4.00% |
5.46% |
5.69% |
6.54% |
|
| Aggressive Hybrid Funds |
|
|
|
|
|
|
|
|
|
|
|
|
| Name of |
|
|
|
|
|
|
|
|
|
|
|
|
| Scheme |
|
|
|
|
|
|
|
|
|
|
|
|
| NIFTY 50 Hybrid Composite Debt 65:35 Index |
|
|
|
|
|
|
|
27.05% |
11.58% |
9.90% |
11.34% |
-- |
|
| Canara Robeco Equity Hybrid Fund |
1-Feb-93 |
Aggressive Hybrid Fund |
Moderately High |
Yes |
Yes |
Yes |
191.77 |
26.70% |
15.03% |
9.44% |
10.82% |
11.34% |
| DSP Equity & Bond Fund |
27-May-99 |
Aggressive Hybrid Fund |
Moderately High |
Yes |
Yes |
Yes |
182.18 |
29.68% |
12.23% |
7.33% |
10.80% |
14.44% |
| Sundaram Equity Hybrid Fund |
23-Jun-00 |
Aggressive Hybrid Fund |
Moderately High |
Yes |
Yes |
Yes |
100.71 |
24.06% |
4.87% |
6.69% |
9.92% |
11.88% |
|
| Dynamic Asset Allocation or Balanced Advantage Funds |
|
|
|
|
|
|
|
|
|
|
|
|
| S&P BSE 200 TRI Index |
|
|
|
|
|
|
|
40.86% |
9.90% |
7.47% |
11.67% |
-- |
| NIFTY Short Duration Debt Index |
|
|
|
|
|
|
|
5.04% |
9.98% |
8.54% |
8.33% |
-- |
| NIFTY 50 Hybrid Composite Debt 65:35 Index |
|
|
|
|
|
|
|
27.05% |
11.58% |
9.90% |
11.34% |
-- |
|
| L&T Balanced Advantage Fund |
7-Feb-11 |
Dynamic Asset Allocation or Balanced Advantage |
Moderately High |
Yes |
Yes |
Yes |
27.76 |
16.62% |
10.49% |
7.21% |
6.80% |
10.97% |
| IDFC Dynamic Equity Fund |
10-Oct-14 |
Dynamic Asset Allocation or Balanced Advantage |
Moderately High |
Yes |
Yes |
Yes |
15.37 |
19.98% |
9.84% |
6.60% |
7.84% |
7.26% |
|
| Equity Savings Funds |
|
|
|
|
|
|
|
|
|
|
|
|
| Name of |
Inception |
SEBI Categorisation |
Riskometer** |
|
|
|
NAV |
Equity Exposure * |
Arbitrage Exposure * |
Returns for |
| Scheme |
Date |
|
|
|
|
|
Rs |
6 m |
1 yr |
Incep |
| 34% NIFTY Short Duration Debt Index, 33% Nifty 50 Index & 33% Nifty 50 Arbitrage Index |
|
|
|
|
|
|
|
|
|
14.82% |
6.53% |
-- |
| Kotak Equity Savings Fund |
13-Oct-14 |
Equity Savings |
Moderately High |
Yes |
Yes |
Yes |
16.09 |
34.38% |
33.66% |
14.86% |
8.08% |
8.07% |
| Axis Equity Saver Fund |
14-Aug-15 |
Equity Savings |
Moderately High |
Yes |
Yes |
Yes |
14.48 |
42.90% |
23.40% |
18.49% |
7.56% |
7.24% |
|
| Equity Linked Saving Schemes |
|
|
|
|
|
|
|
|
|
|
|
|
| Name of |
Inception |
SEBI Categorisation |
Riskometer** |
|
|
|
NAV |
Returns for |
| Scheme |
Date |
|
|
|
|
|
Rs |
6 m |
1 yr |
3 Yrs |
5 Yrs |
Incep |
| S&P BSE 100 TRI Index |
|
|
|
|
|
|
|
39.90% |
8.57% |
7.70% |
11.53% |
-- |
| S&P BSE 200 TRI Index |
|
|
|
|
|
|
|
|
|
7.47% |
11.67% |
-- |
| Nifty 500 TRI Index |
|
|
|
|
|
|
|
42.04% |
10.30% |
6.20% |
11.22% |
-- |
|
| Canara Robeco Equity Tax Saver Fund |
2-Feb-09 |
ELSS |
Moderately High |
Yes |
Yes |
Yes |
80.44 |
37.67% |
18.74% |
11.26% |
12.06% |
19.28% |
| Axis Long Term Equity Fund |
29-Dec-09 |
ELSS |
Moderately High |
Yes |
Yes |
Yes |
55.33 |
38.98% |
13.67% |
11.12% |
12.89% |
16.96% |
| Kotak Tax Saver Fund |
23-Nov-05 |
ELSS |
Moderately High |
Yes |
Yes |
Yes |
50.78 |
37.36% |
9.70% |
6.14% |
10.97% |
11.42% |
|
| Index Funds |
|
|
|
|
|
|
|
|
|
|
|
|
| Name of |
Inception |
SEBI Categorisation |
Riskometer** |
|
|
|
NAV |
Returns for |
| Scheme |
Date |
|
|
|
|
|
Rs |
6 m |
1 yr |
3 Yrs |
5 Yrs |
Incep |
| Nifty 50 Index |
|
|
|
|
|
|
|
39.23% |
7.15% |
7.63% |
10.29% |
-- |
| Nifty 50 TRI Index |
|
|
|
|
|
|
|
40.21% |
8.29% |
8.99% |
11.70% |
-- |
|
| UTI Nifty Index Fund |
14-Feb-00 |
Index Funds |
Moderately High |
Yes |
Yes |
Yes |
85.57 |
40.04% |
7.69% |
8.59% |
11.26% |
10.87% |
| HDFC Index Fund-NIFTY 50 Plan |
17-Jul-02 |
Index Funds |
Moderately High |
Yes |
Yes |
Yes |
118.70 |
39.82% |
7.35% |
8.40% |
11.07% |
14.21% |
|
| Sectoral/Thematic and Other Funds |
|
|
|
|
|
|
|
|
|
|
|
|
| Aditya Birla Sun Life Manufacturing Fund |
31-Jan-15 |
Thematic |
High |
Yes |
No |
No |
14.91 |
33.01% |
13.95% |
0.77% |
8.75% |
7.10% |
| Nippon India Power & Infra Fund |
8-May-04 |
Thematic |
High |
Yes |
No |
No |
97.46 |
35.66% |
2.82% |
-5.81% |
5.64% |
14.73% |
| ICICI Prudential Multi-Asset Fund |
31-Oct-02 |
Multi Asset Allocation |
Moderately High |
Yes |
Yes |
Yes |
280.70 |
18.91% |
2.64% |
2.55% |
8.96% |
20.25% |
| DSP US Flexible Equity Fund |
3-Aug-12 |
FoF - Overseas |
High |
Yes |
No |
No |
34.04 |
21.93% |
24.72% |
16.38% |
13.83% |
15.86% |
|
| Gold Funds |
|
|
|
|
|
|
|
|
|
|
|
|
| Name of |
Inception |
SEBI Categorisation |
Riskometer** |
|
|
|
NAV |
Returns for |
| Scheme |
Date |
|
|
|
|
|
Rs |
6 m |
1 yr |
3 Yrs |
5 Yrs |
Incep |
| Physical Gold |
|
|
|
|
|
|
|
2.35% |
27.80% |
18.21% |
13.86% |
-- |
|
| Kotak Gold Fund |
25-Mar-11 |
FoF - Domestic |
Moderately High |
Yes |
Yes |
Yes |
20.14 |
4.57% |
27.67% |
17.52% |
12.80% |
7.50% |
| HDFC Gold Fund |
1-Nov-11 |
FoF - Domestic |
Moderately High |
Yes |
Yes |
Yes |
15.59 |
4.64% |
28.37% |
16.85% |
12.69% |
5.01% |
|
Source for entire data stated above is ICRA Analytics Ltd. (For Disclaimer of ICRA Analytics Ltd, refer https://icraanalytics.com/home/disclaimer)
As per SEBI circular dated September 13, 2012, fresh subscriptions/switch-ins will be accepted only under a single plan for all the schemes w.e.f from 1st October 2012.
Note: Return figures for all schemes are absolute for <= 1 year and compounded annualised for > 1 year.
Past returns cannot be taken as an indicator of future performance.
All the NAVs and return calculations are for the Growth Oriented Plans, unless mentioned otherwise.
* Data As On 30 October, 2020
Equity Oriented Scheme recommendations have been made based on the methodology, which assigns weightages to parameters
like FAMA, Sharpe Ratio, Sortino Ratio, Corpus, Past Performance, Beta and Volatility.
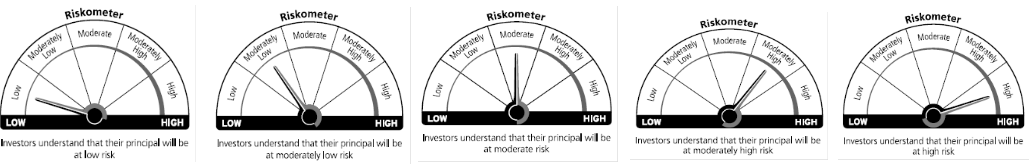
** As disclosed by the respective Asset Management Companies. Refere to the Riskometer Index
|
| |
| Riskometer Index |
 |
| |
| |
Disclaimer: This document has been prepared on the basis of publicly available information, internally developed data and other sources believed to be reliable. HDFC Bank Limited ("HDFC Bank") does not warrant its completeness and accuracy. This information is not intended as an offer or solicitation for the purchase or sale of any financial instrument / units of Mutual Fund. Recipients of this information should rely on their own investigations and take their own professional advice. Neither HDFC Bank nor any of its employees shall be liable for any direct, indirect, special, incidental, consequential, punitive or exemplary damages, including lost profits arising in any way from the information contained in this material. HDFC Bank and its affiliates, officers, directors, key managerial persons and employees, including persons involved in the preparation or issuance of this material may, from time to time, have investments / positions in Mutual Funds / schemes referred in the document. HDFC Bank may at any time solicit or provide commercial banking, credit or other services to the Mutual Funds / AMCs referred to herein.
Accordingly, information may be available to HDFC Bank, which is not reflected in this material, and HDFC Bank may have acted upon or used the information prior to, or immediately following its publication. HDFC Bank neither guarantees nor makes any representations or warranties, express or implied, with respect to the fairness, correctness, accuracy, adequacy, reasonableness, viability for any particular purpose or completeness of the information and views. Further, HDFC Bank disclaims all liability in relation to use of data or information used in this report which is sourced from third parties.
HDFC Bank House, 1 st Floor, C.S. No. 6 \ 242, Senapati Bapat Marg, Lower Parel, Mumbai 400 013. Phone: (91)-22-66527100, ext 7111, Fax: (91)-22-24900983 \ 24900858
Mutual fund investments are subject to market risks, read all scheme related documents carefully.
|
| |
| |
| |
|
|